Pillow 教程
PIL(Python Image Library)是python的第三方图像处理库。其官方主页为:PIL。 PIL历史悠久,原来是只支持python2.x的版本的,后来出现了移植到python3的库pillow, pillow号称是friendly fork for PIL。
Pillow is the friendly PIL fork by Alex Clark and Contributors. PIL is the Python Imaging Library by Fredrik Lundh and Contributors.
for Python2 Python Imaging Library (PIL)
for Python3 The Python Imaging Library Handbook
1 | from PIL import Image |
从一个文件加载图片,使用在Image模块下的open()函数。
1 | im = Image.open("lena.jpg") |
1. 使用Image类
如果成功,这个函数会返回一个Image目标。你可以使用实例属性去测试这个文件的内容:
1 | from __future__ import print_function |
JPEG (512, 512) RGBformat属性判断图片的来源。如果一个图片不是从一个文件读入,它会被设置成None。size属性是一个2元组,包含宽和高。mode属性定义图片通道的数量和名字,以及像素类型和深度。通常的模式包含:“L”(luminance)表示灰度图像,”RGB“表示真彩色图像,”CMYK“表示印前(pre-press)图像
如果文件没有被打开,会给出IOError。
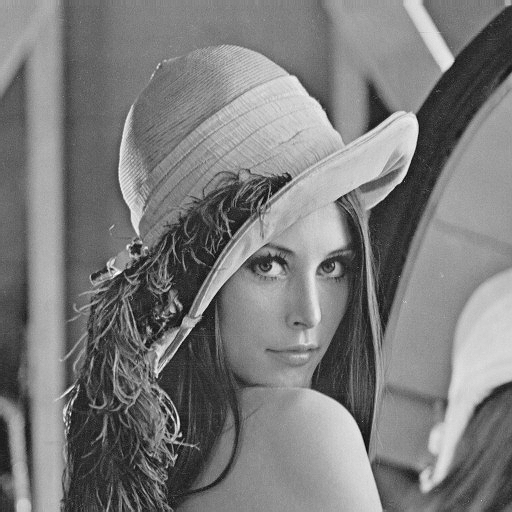
一旦你有一个Image类的实例,你可以使用这个类定义的方法取处理这个图片。例如,显示我们刚加载的图片:
1 | im.show() |
使用matplotlib进行可视化
1 | plt.imshow(im) |
<matplotlib.image.AxesImage at 0x7f1173b85518>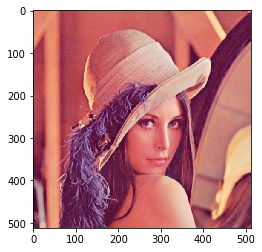
2. 读取和写入图像
3. 剪切、复制和合并图像
Image类包含允许您操作图像中的区域的方法。要从图像中提取矩形区域,请使用crop()方法。
从一个图片中复制一个矩形区域
1 | box = (100, 100, 400, 400) |
(300, 300)这个区域使用一个4元组定义,它的坐标是(left, upper, right, lower)。Python Imaging Library在左上角使用(0, 0)的坐标系统。坐标表示像素之间的位置,因此上边例子中的区域是300x300像素。
处理一个矩形区域,并且把它粘贴回原来位置
1 | region = region.transpose(Image.ROTATE_180) |
<matplotlib.image.AxesImage at 0x7f11721e2518>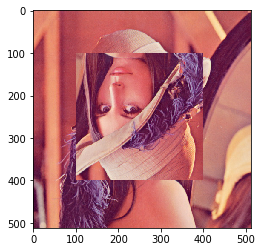
当把区域粘贴回去,区域的尺寸必须相同。除此之外,这个区域不能超越图像的边界。
1 | def roll(image, delta): |
拆分和合并通道
1 | r, g, b = im.split() |
<matplotlib.image.AxesImage at 0x7f11721c9b38>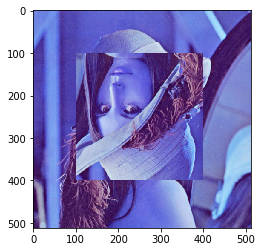
保存图像
1 | im.save(r'out.jpg') |
新建图像
1 | newIm= Image.new('RGB', (50, 50), 'red') |
<matplotlib.image.AxesImage at 0x7f1175c2d630>
1 | # 十六进制颜色 |
<matplotlib.image.AxesImage at 0x7f1175bfd8d0>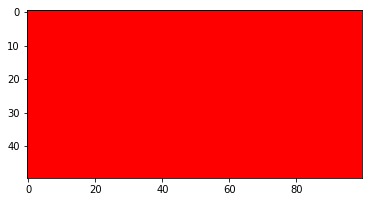
1 | # 传入元组形式的RGBA值或者RGB值 |
<matplotlib.image.AxesImage at 0x7f1175bd1be0>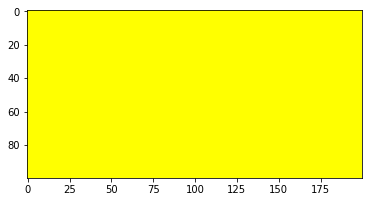
复制图片
1 | copyIm = im.copy() |
(512, 512)调整图片大小
1 | width, height = copyIm.size |
(512, 256)4. 几何变换
1 | im = Image.open("lena.jpg") |
<matplotlib.image.AxesImage at 0x7f11721370b8>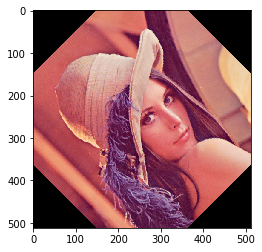
转置图像
1 | out = im.transpose(Image.FLIP_LEFT_RIGHT) |
<matplotlib.image.AxesImage at 0x7f1172111080>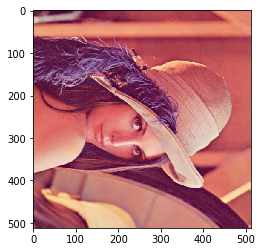
5. 颜色变换
在不同models之间转换
1 | from PIL import Image |
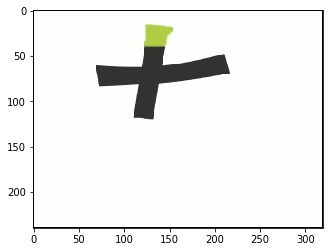
L6. 图片增强
滤波器
1 | from PIL import ImageFilter |
<matplotlib.image.AxesImage at 0x7f1172073860>
1 | # 高斯模糊 |
<matplotlib.image.AxesImage at 0x7f117204f470>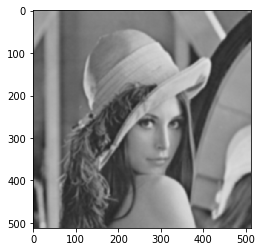
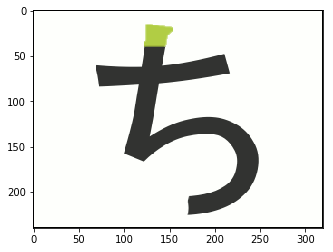
1 | # 边缘增强 |
<matplotlib.image.AxesImage at 0x7f1171faf0b8>
1 | # 普通模糊 |
应用点变换
1 | # multiply each pixel by 1.2 |
增强图像
1 | from PIL import ImageEnhance |
<matplotlib.image.AxesImage at 0x7f1171f906a0>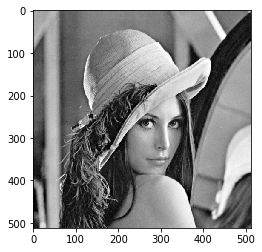
7. 图片序列
1 | from PIL import Image |
1 | plt.imshow(im) |
<matplotlib.image.AxesImage at 0x7f1171eec208>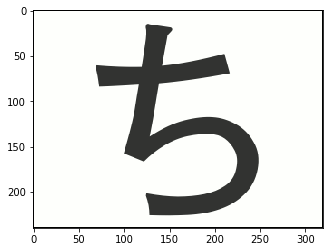
使用ImageSequence Iterator类
1 | from PIL import ImageSequence |

8. Postscript printing
Drawing Postscript
1 | from PIL import Image |
%!PS-Adobe-3.0
save
/showpage { } def
%%EndComments
%%BeginDocument
/S { show } bind def
/P { moveto show } bind def
/M { moveto } bind def
/X { 0 rmoveto } bind def
/Y { 0 exch rmoveto } bind def
/E {    findfont
        dup maxlength dict begin
        {
                1 index /FID ne { def } { pop pop } ifelse
        } forall
        /Encoding exch def
        dup /FontName exch def
        currentdict end definefont pop
} bind def
/F {    findfont exch scalefont dup setfont
        [ exch /setfont cvx ] cvx bind def
} bind def
/Vm { moveto } bind def
/Va { newpath arcn stroke } bind def
/Vl { moveto lineto stroke } bind def
/Vc { newpath 0 360 arc closepath } bind def
/Vr {   exch dup 0 rlineto
        exch dup neg 0 exch rlineto
        exch neg 0 rlineto
        0 exch rlineto
        100 div setgray fill 0 setgray } bind def
/Tm matrix def
/Ve {   Tm currentmatrix pop
        translate scale newpath 0 0 .5 0 360 arc closepath
        Tm setmatrix
} bind def
/Vf { currentgray exch setgray fill setgray } bind def
%%EndProlog
gsave
226.560000 370.560000 translate
0.960000 0.960000 scale
gsave
10 dict begin
/buf 384 string def
128 128 scale
128 128 8
[128 0 0 -128 0 128]
{ currentfile buf readhexstring pop } bind
false 3 colorimage

%%%%EndBinary
grestore end

grestore
72 144 M 504 720 0 Vr
/PSDraw-HelveticaNarrow-Bold ISOLatin1Encoding /HelveticaNarrow-Bold E
/F0 36 /PSDraw-HelveticaNarrow-Bold F
216 288 M (hopper) S
%%EndDocument
restore showpage
%%End
9. 更多关于图像读取
1 | from PIL import Image |
<matplotlib.image.AxesImage at 0x7f1171d5a400>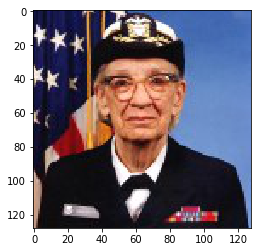
1 | from PIL import Image |

10. 控制解码器
使用草稿(draft)模式读取
1 | im = Image.open("lena.jpg") |
original = RGB (512, 512)
draft = L (128, 128)
1 |